Many years ago I remember reading about irrational numbers and the various surprising things they hide. One nice thing about irrationals is that even thought we think of them as being bad behaved and ugly, we can still classify them further. For example, we have irrationals that are also algebraic, that is, they are zeros of a polynomial with integer coefficients.
We can think that rationals are algebraic of degree 1, while algebraic of degree 2 include $\sqrt{2}, \sqrt{3} $, the golden ratio, etc.
Then we have numbers that are not algebraic, that is, they are not zeros of polynomials with integer coefficients. These are called Transcendental. Some of the famous ones in this category are $\pi, e$, Liouville's constant, etc.
Another way of studying irrational numbers is by measuring how irrational are they. This really means to study how well a number can be approximated with rational numbers, that is, loosely speaking, how fast the denominators of the fractions approximating the number have to grow to stay close to it.
We can think that this has to do with the representation of real numbers with approximations by rationals. In a more philosophical way, this irrationality measure can tell how well we can approximate numbers in the math world, with numbers in the real world.
Liouville was big into approximating irrationals with rationals trying to do it in the most efficient way, that is, controlling the size of the denominators. More recently, Roth made contributions into a deeper understanding of this, leading him to win the Fields Medal in 1958.
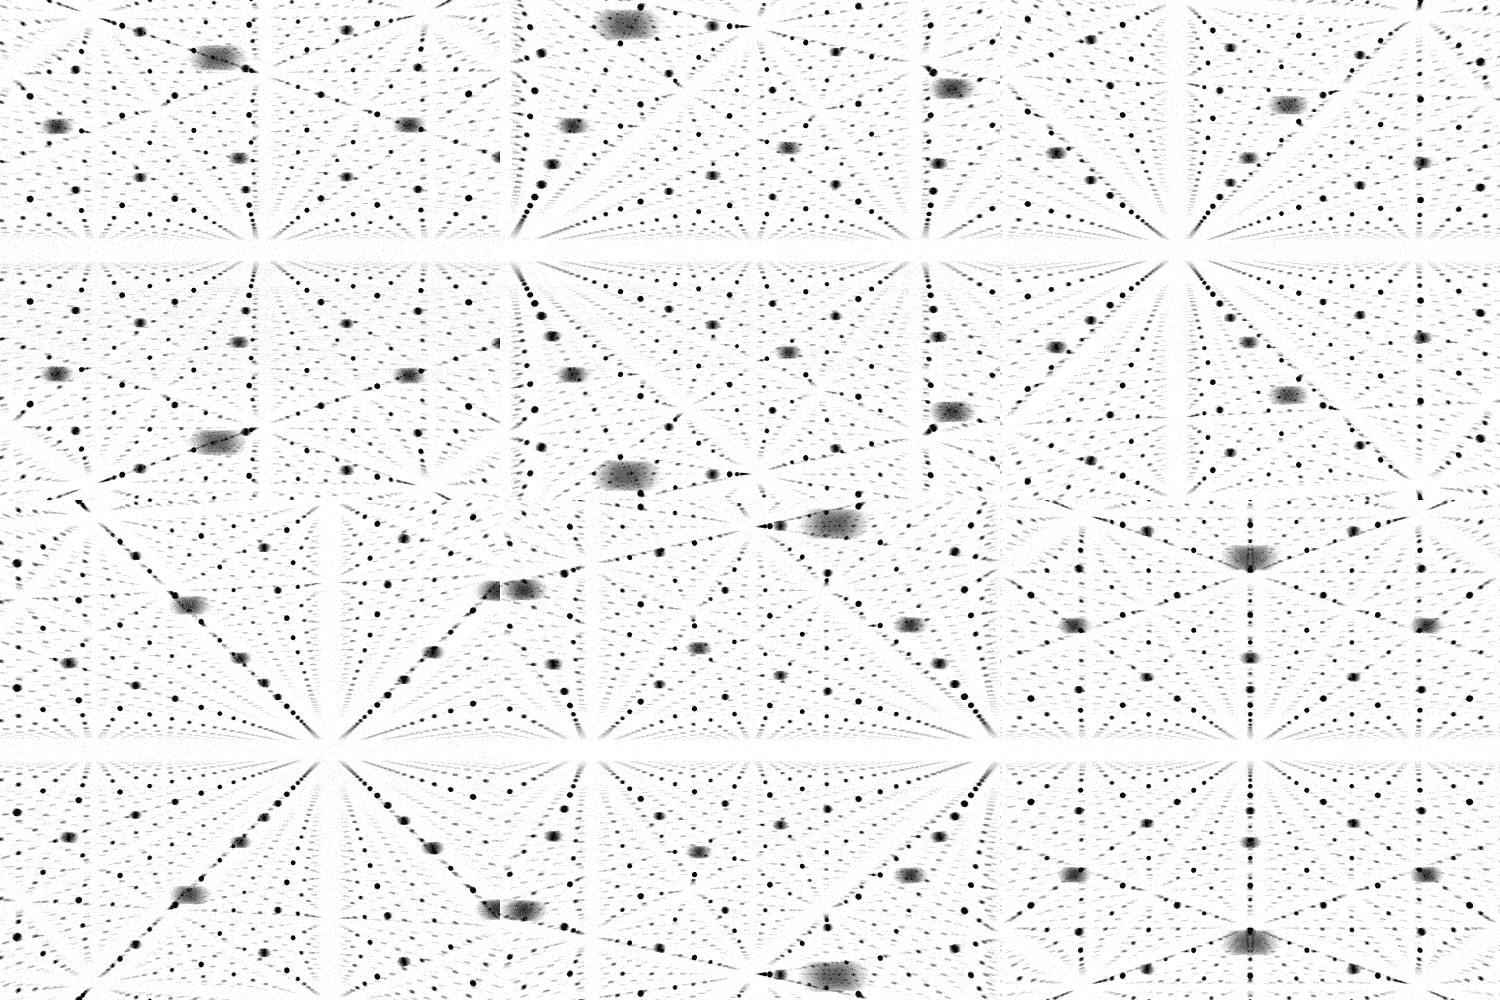
Looking at this Facebook post about the integer lattice in $\mathbb{R}^3$, I remember an attempt at defining another way of measuring the irrationality of a number.
First, consider the integer lattice in $\mathbb{R}^2$. Given a real number $m$, graph the line $y=mx$. Thus the line will hit the lattice if and only if $m$ is rational, so the idea is to analyze what happens when $m$ is irrational.
For this, consider the following: consider a radius $r>0$ and draw the biggest circular sector of radius $r$ that is symmetric around the line $y=mx$ and that does not contain any point of the lattice.
That is, the sector must not contain any of the blue points from the lattice. Now, the idea is to measure this area and treat it as a function of the radius $A_m(r)$. I created a GeoGebra demonstration to show the idea of the sector.
Here you can see how the area of the sector changes when the radius changes, and also how the procedure varies when considering different values for $m$.
Effectively what happens is that we are looking for the best approximation of the number $m$ using a fraction $p/q$ with $p^2+q^2\leq r^2$. This way we control the size of both numbers for the approximation of $m$.
Thus we have that
$$A_m(r)=r^2\big|\arctan(m)-\arctan(f_m(r))\big|\,,$$
where $f_m(r)$ is the best approximation to $m$ with a rational inside the circle of radius $r$, that is
$$f_m(r)=\min \big|m-\frac{p}{q}\big|\,,\quad \text{ where }p^2+q^2\leq r^2\,.$$
Now, the trick is to analyze $A_m(r)$ as $r\to\infty$. One might think that this is trivially zero, since any irrational can be written as the limit of a sequence of rationals, but we also have the radius growing up to infinity, hence becoming an indeterminate form.
That is, it might be possible to propose another irrationality measure as
$$\nu(m)=\lim_{r\to\infty} \sup A_m(r)\,.$$
The $\sup$ just ensures the existence of $\nu(m)$, we don't even know if there is a limit!
If $m$ is rational, this is exactly zero, but the question would be what happens for $m$ irrational. I did some numerics to have an idea of this measure for a couple of cases. Of course this is no evidence, as a limit like this cannot be trivially calculated using numerical methods, but at least gives a bit of insight.
For example, for $m=\sqrt{2}$ we have that the graph of $A_{\sqrt{2}}(r)$ seems to oscillate between 0.2 and 1.4. We can see here that the peaks happen when a new rational approximation is found. Naively speaking, $\sqrt{2}$ is not hard to approximate with rationals, and hence we don't have to increase too much in $r$ to find a new approximation.
On the other hand, for $m=\pi$ we have a different behavior. We have a series of good approximations, but then suddenly we cannot find any more good approximations. Even though it looks like $A_\pi(r)$ went to 0 around $r=400$, if we zoom in we can see that it is slowly rising finding a new approximation.
I believe this is a very interesting topic and I think there is something nice waiting to be discovered here. Even if it leads to the same notion as the Liouville-Roth exponent, this would provide a more geometric interpretation of the behavior of irrational numbers.


